FREE BOOKS REVEALS…
“CHART PATTERNS AND STRATEGIES THAT EVERY 
INVESTOR MUST KNOW”

Know When To Buy And When To Sell To MAXIMIZE Your Profits

LIMITED TIME FREE OFFER:

EVERYTHING YOU GET

  • Free Digital copy of Seven Habits of a Highly Successful Trader
    (Value $115)
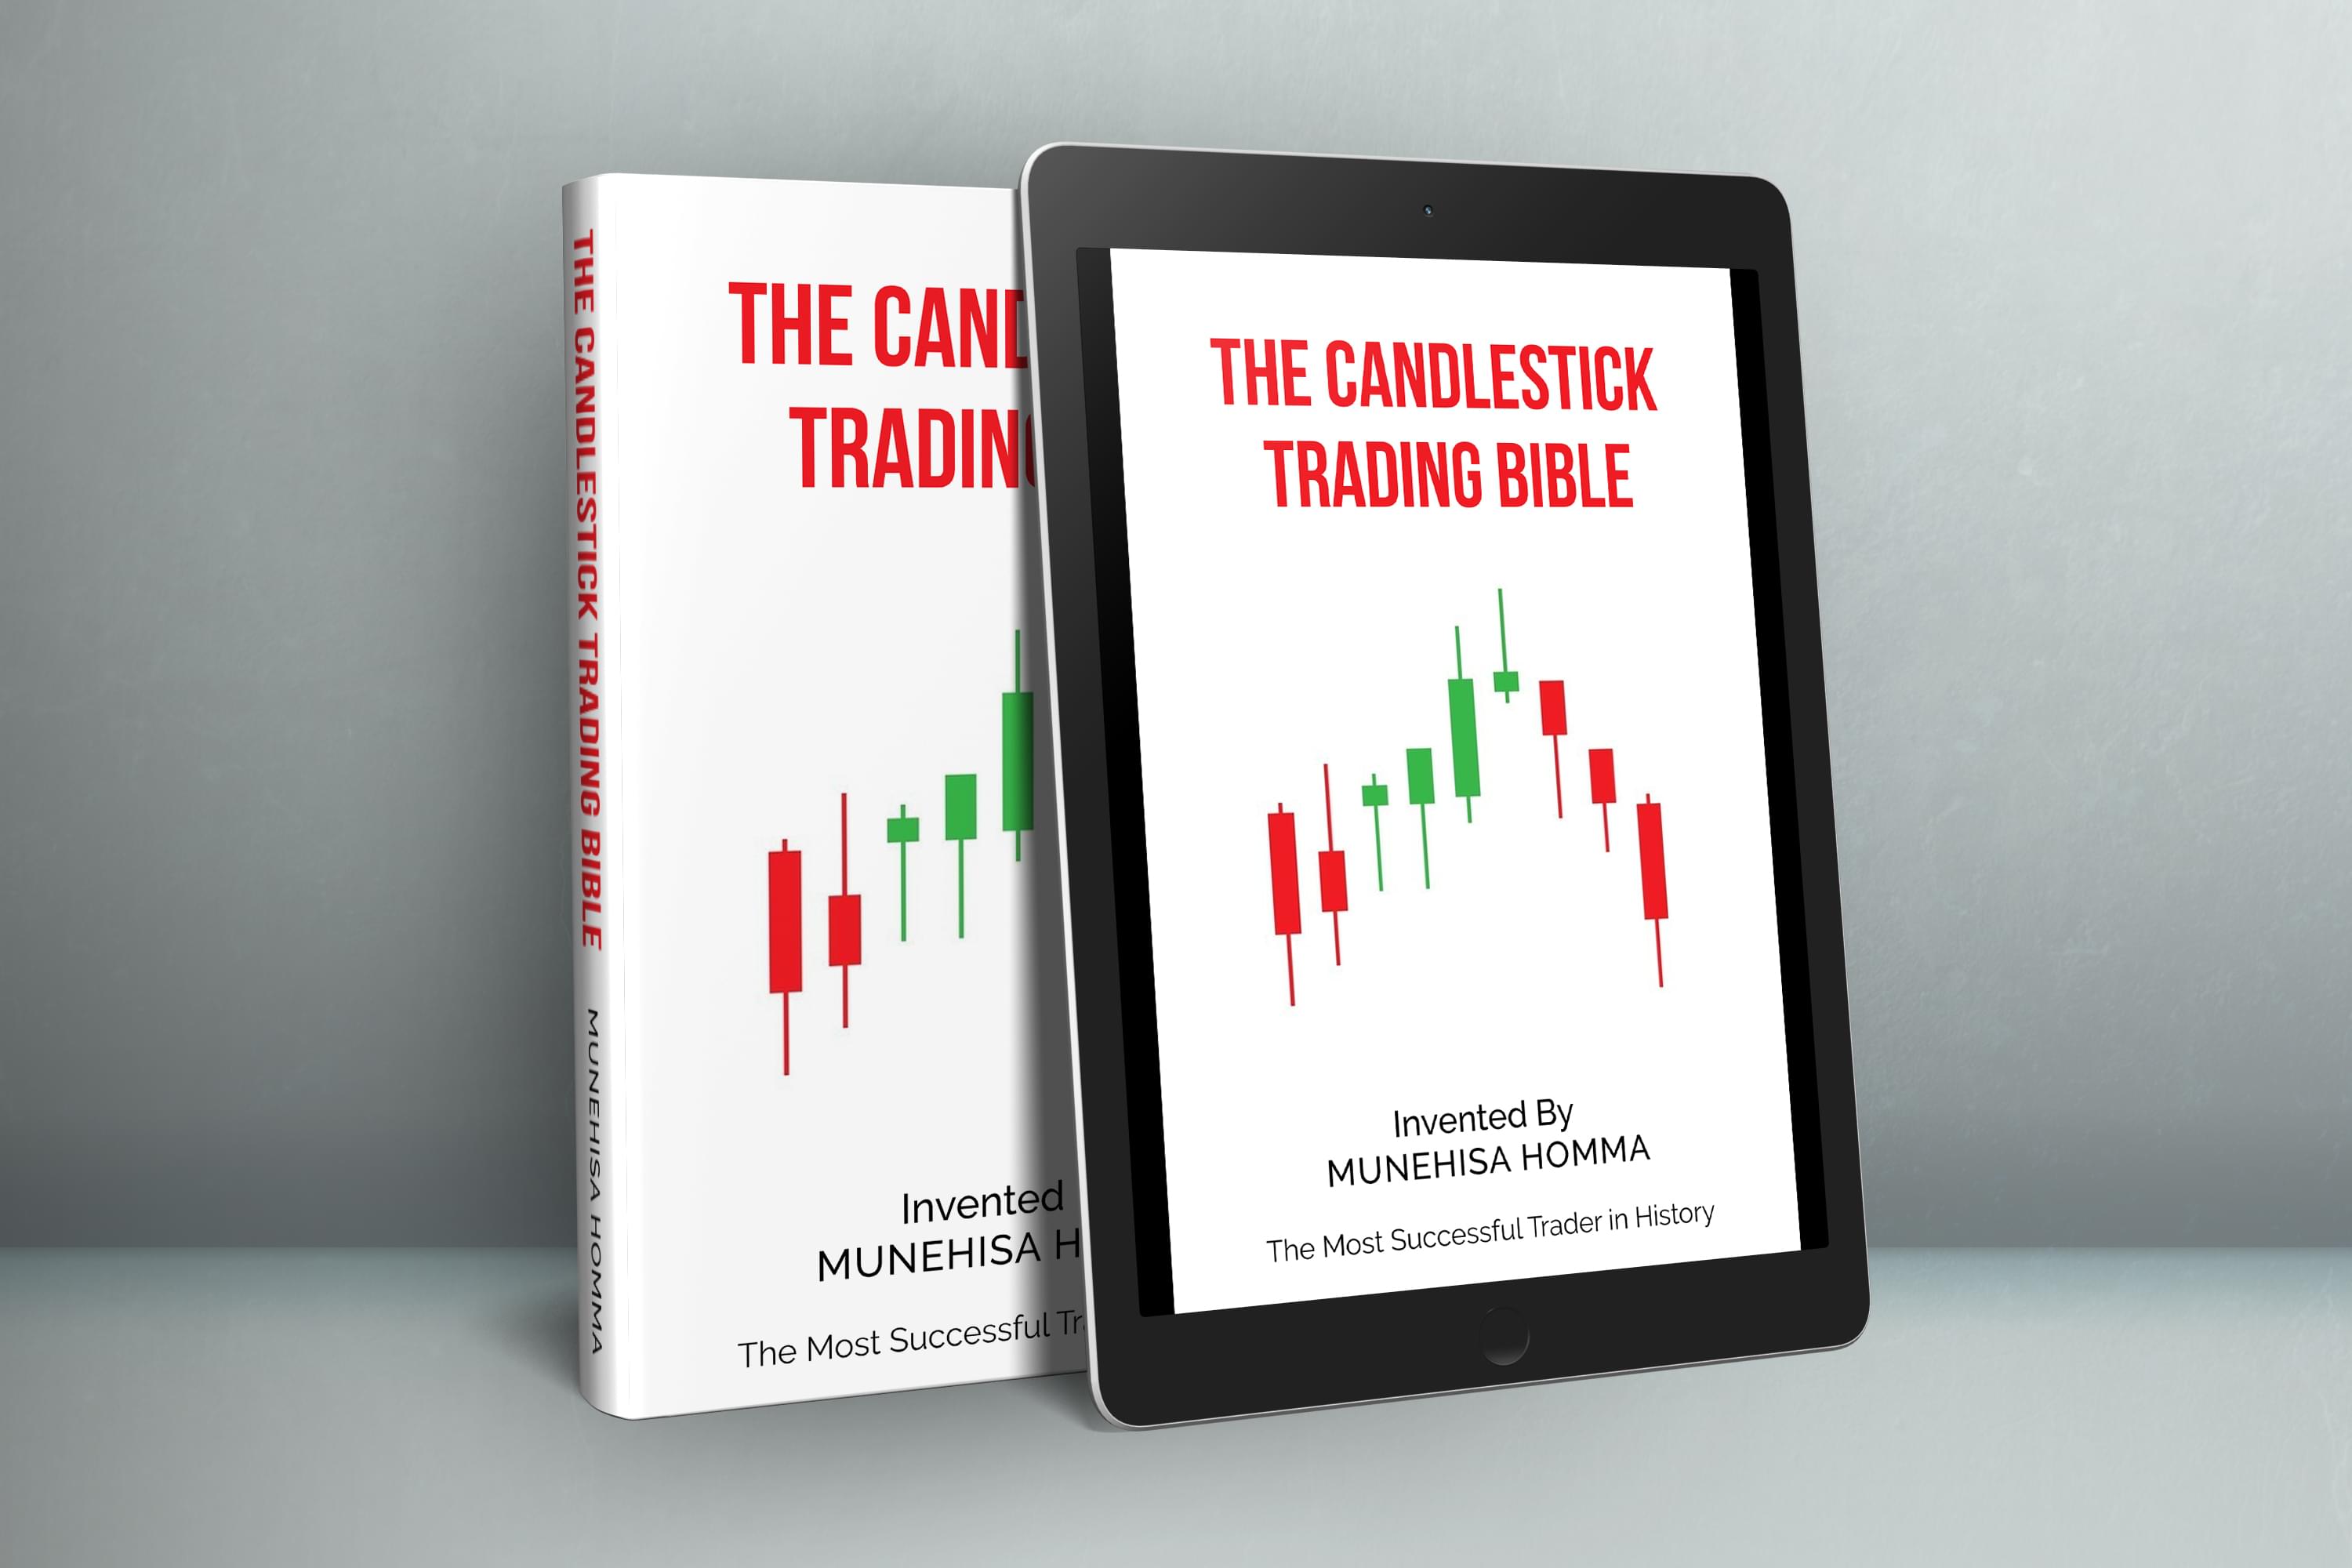
  • Free Digital copy of The Candlestick Trading Bible. 
    (Value $79)
  • ​Free Digital copy of The Price Action Trader
     (Value $49)
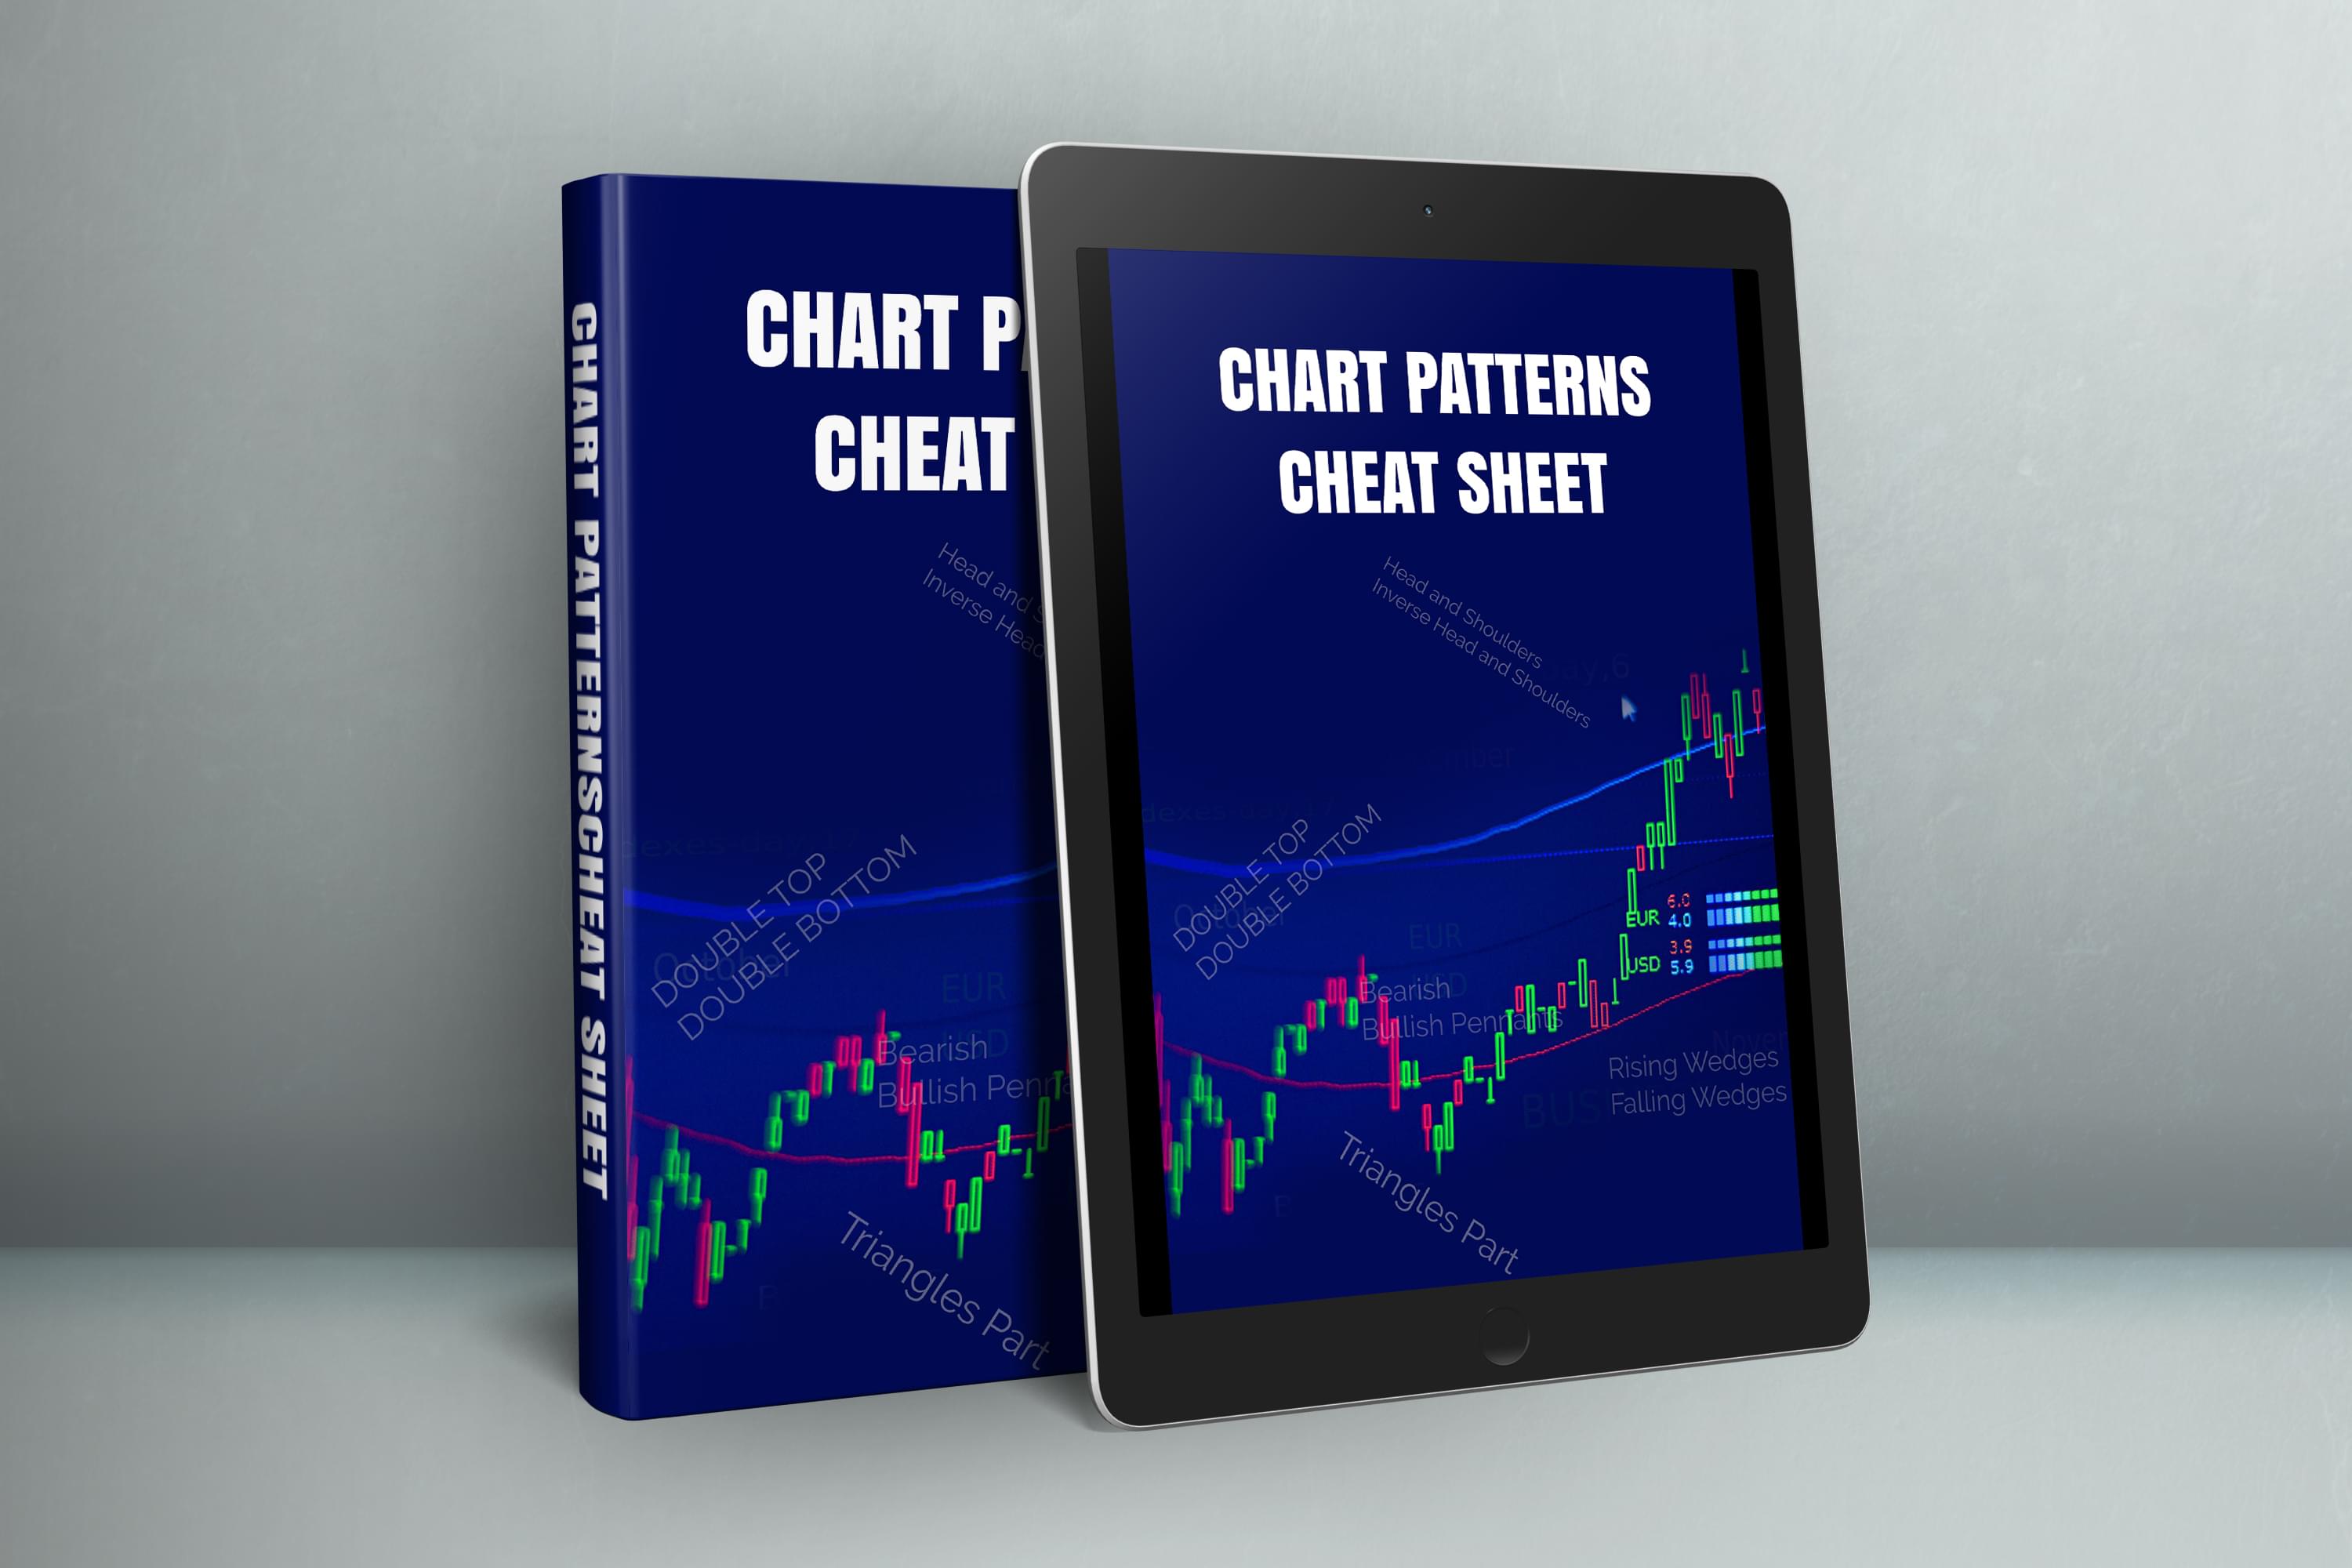
  • ​Free Digital copy of Our exclusive Candlestick “Cheat Sheet”
     (Value $89)

$332 Value - YOURS FREE!

HURRY! THIS IS A LIMITED TIME PROMOTION
countdown
00Hours00Minutes00Seconds

IMPORTANT NOTE: THIS FREE OFFER WON’T LAST LONG!

Dear Reader,

When you think of stock charts, you probably think of a bunch of dots and lines that tell you how a company has performed over a few days, a year, or even a decade.

You might even be familiar with some of the more common types of charts out there…

Like head and shoulders, double tops, or even wedges.

But did you know there are actually five variations of head and shoulders charts?

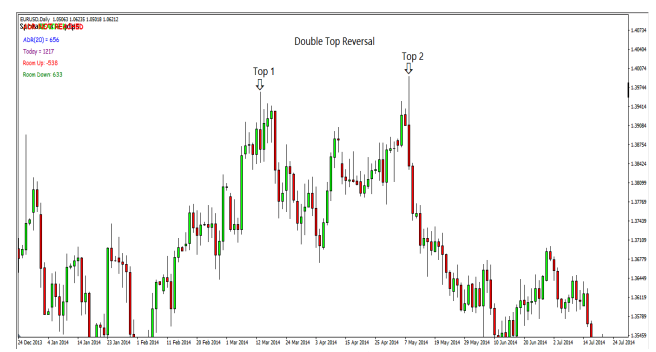
Or that there are three different types of double tops?

Or that wedge charts have two varieties?

If you did, then you’re ahead of the game.

But if you’re like most investors, what I just told you probably came as a bit of a shock.

After all, even experienced investors I’ve spoken with have no idea what they’re really seeing when looking at stock charts.

However, the minute you’re able to fully understand what type of chart pattern you’re actually looking at…

It’s so much easier to trade the charts.
Better yet, the book I’m about to tell you more about is FREE to you today (so long as this promotion is still active).

And if that’s not good enough, I’m going to reveal THREE of the patterns from the book right here in this presentation.

So let’s get into it…


The most important skill you’ll ever learn.”

It’s no secret that a quick glimpse at a stock chart can tell you whether share prices of a company are headed up or down…

But a longer look at that same chart can reveal several secrets that aren’t so apparent with just a fast peek.

And it’s these secrets that often tell the difference between whether you’re about to lose your shirt or rake in a dream payday…
Which is why it’s no surprise that Investor’s Business Daily says,
“Chart-reading is the single most important skill you’ll ever learn.”

And the first step is understanding what these charts actually represent.

As I mentioned, you can quickly check out whether a stock is up or down…

But it’s important to realize why it’s happening.

You see, fund managers and institutional investors account for 80% of all trading activity in the market.

And that’s because they’re moving millions of dollars around at a time.

This activity either pushes stocks up or down…

So your goal is to buy stocks the big boys (institutions, etc..) are buying and avoid stocks they’re selling.

Sounds simple, but it’s not.

And this is where stock charts come in.

Once you know what to look for, you’ll quickly understand that these charts show you, quite clearly, what these mega-investors are doing.

And you can use this information to buy, sell, or hold your stock positions.

Thing is, there’s no “magic bullet.”

There’s no single chart pattern that you can use every time.

And that’s why I’m here today…
HURRY! THIS IS A LIMITED TIME PROMOTION
countdown
00Hours00Minutes00Seconds

Somethings You Might Be Wrong About

It’s just not enough to simply glance at a chart and enter a trade based on what you see in just a few seconds time.

Even when you think you know what you’re looking at, there are often hidden secrets that can change everything.

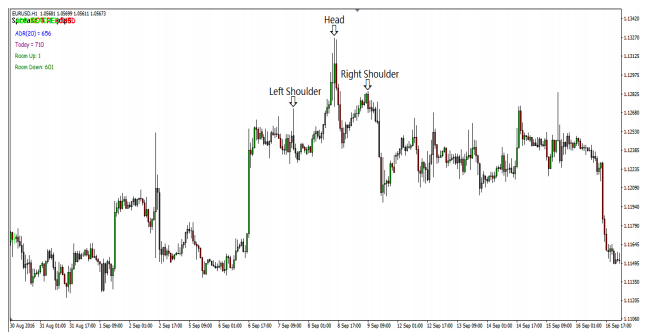
For instance, take a look at this chart…
This is your classic head and shoulders chart…

And if you’re familiar with it, you know that it’s a bearish signal.

In other words, it tells you it’s time to sell.

Easy enough, right?

Well, not really.

While this chart, in particular, is a signal to sell…

There’s actually another version of this very same pattern that is actually a signal to buy.

Do you know what it looks like?

Don’t feel bad if you don’t. Most people have no idea.

But my point is, there are hidden secrets in almost every chart.

And many times, these secrets are the difference between losing money and making out like a bandit.

The good news is, our The Price Action Trader – which is absolutely FREE to you today – shows you these pattern variations so you can easily spot the perfect times to buy and sell whatever stocks you’re looking at.
In fact, we reveal every head and shoulders pattern – along with exactly what they look like – on pages 23-27.

But we don’t just cover the five variations of head and shoulders charts…

In the The Price Action Trader we also cover some of the lesser known patterns…

These are patterns even experienced investors often overlook or don’t even know about.

And I’m going to show you THREE of them right now.

Consider this a sneak peek of your FREE copy of the The Price Action Trader.
HURRY! THIS IS A LIMITED TIME PROMOTION
countdown
00Hours00Minutes00Seconds

3 Stock Chart Patterns You’ve Probably Never Heard About

or have, but have no clue how to trade them

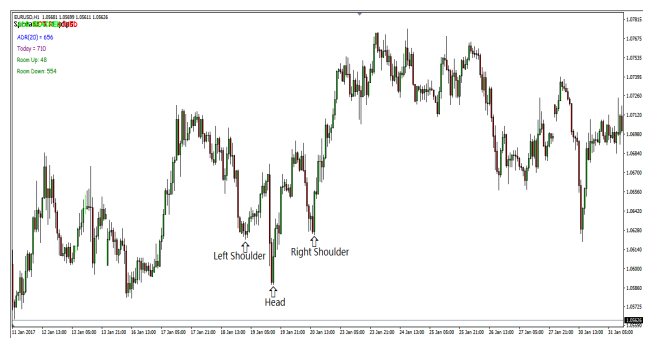
Have you ever heard of a chart pattern called inverted head and shoulders?

Well it looks something like this:
But what does it mean?

You can see that all the features of the pattern are the same as the bearish version, only the opposite way around. Instead of the head pointing upwards like it does with the bearish pattern it points down, as do the left and right shoulders.

The only real difference between the two patterns is in what needs to happen in order for the pattern to become invalidated.

 If you want to learn the best way to trade the head and shoulders pattern and get a more in-depth look at the way it should
form on your charts, the The Price Action Trader Download goes over this in details!
So what about a  Rising And Falling Wedge Pattern? 

A signal to buy? or sell?
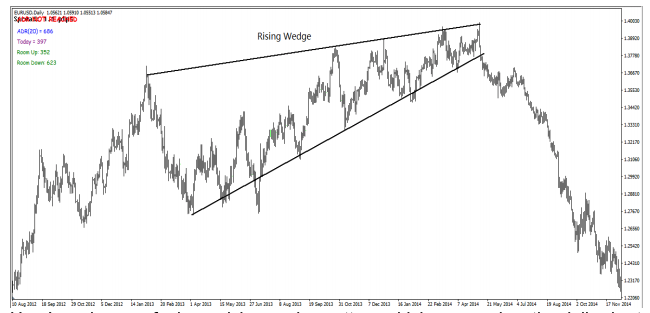
The rising and falling wedges are two patterns
which get their name from the way the market sometimes contracts before the end of an up-move or down-move. 

The contraction of the swings is what creates the wedge and gives the patterns their name.


It’s obvious here that the stock eventually went up…. and the Sold.

But earlier on, it was on a clear up trend, which would have had most traders induced to buy. 

That’s what most people would do.

But if you know what this particular pattern means, you’ll know that it’s actually the perfect time to make a sell… and wait for the potential massive gains everyone else missed out on or lost hundreds to the market.

So it’s a good thing we reveal everything about this pattern in the The Price Action Trader (on page 7).
HURRY! THIS IS A LIMITED TIME PROMOTION
countdown
00Hours00Minutes00Seconds
Plus, in addition to the three patterns I just showed you, we cover additional patterns that are essential to every investor.

So how do you get your FREE copy of the Bundle I am offering you today?

I’m about to show you…

Claim Your FREE Copy 

While this Promotion Lasts

HURRY! THIS IS A LIMITED TIME PROMOTION
countdown
00Hours00Minutes00Seconds
And once you have it in hand, you’ll immediately have access to:


A chart pattern that appears often but you’ll definitely want to how to trade effectively 
The bullish pin bar, which signals a reversal to the upside may be about to take place, and the bearish pin bar, which is a sign a reversal to the downside is probably going to occur.
And that’s just an idea of what you’ll receive…


But here’s the REAL kicker…

A FREE copy of the The Price Action Trader isn’t the only thing you’ll receive today.

Nope.

We’re also throwing in exclusive access to three downloadable bonus reports you won’t find anywhere else.

The three bonus downloads included are:

Seven Habits of a Highly Successful Trader

In this book, you will learn how to 

1. Take Complete Responsibility:
2. Have a System That fits You:
3. Plan a Trade and Trade a Plan:
4. Work Hard at Learning How to Trade Properly and Keep Working:

and More!

(Value $115 – Yours FREE)

The Candlestick Trading Bible

The Candlestick trading bible is one of the most powerful trading
systems in history. It was invented by Homma Munehisa. The father of
candlestick chart patterns.

This trader is considered to be the most successful trader in history, he
was known as the God of markets in his days, his discovery made him
more than $10 billion in today’s dollar.

(Value $79 – Yours FREE)

Our exclusive Chart Patterns “Cheat Sheet”

Get Access to our ultimate chart patterns cheat sheet for you to master the bullish, bearish, reversal and continuation patterns.

This cheat sheet will help you to easily identify what kind of candlestick pattern you are looking at whenever you are trading

(Value $89 – Yours FREE)

The Price Action Trader

Learn how to have deep understanding of the various
different price action patterns that form in the market.

Because there are so many of them that form in the market,
knowing which ones you should take the time out to learn and which you should leave can be quite challenging.

(Value $49 – Yours FREE)

$332 Value - YOURS FREE!

With all of these ebooks in hand you’ll have a complete arsenal at your disposal to improve your trading skills.

And it’s ALL FREE.


If you’re serious about investing, this offer is a no-brainer.

I literally couldn’t have made it any easier for you.

You get $332 worth of research and investment materials just by taking action today!

Of course, you might be wondering: Since this offer is so incredible, what’s the catch?

There is Absolutely No Catch, Whatsoever.

 Not a Single One.

I know many of the folks who’ve already claimed this book were surprised when it showed up in their email inboxl.

They thought this might have been a fake offer.

And that’s understandable. There are a ton of websites out there that promise you the world, and then they don’t deliver.

In other words, they give you offers they can’t fulfill.

That’s not how it works here at GLFX Academy. We fulfill on EVERY promise we make.

We spell out everything you get. There are no hidden fees or gimmicks here.

I’m literally giving you The Price Action Trader and Bundle for FREE.

All I ask is that you take action today. That’s it. It’s that simple and straightforward.

And on top of that, I’ll include every last bonus I’ve already described.

Even having said that, I know some folks will still wonder…

Why Am I Giving This Book Bundle Away for FREE?

Well, it’s actually pretty simple.

We consider it our collective job to help as much people as we can gain the skills it takes to make as much money as possible and become the best traders they can be.

And if that means giving this bundle away for free to get you started, then that’s what we’re going to do.

Few companies are willing to do this. And even when they do, the information they give out is dated or incomplete.

That’s not us. We are absolutely willing to give our best research out for free if it means it helps you as a trader.

It’s just that simple. There are no “underground” reasons.

On top of that, it’s important to us that you understand there is no key to getting rich overnight.

All of the most successful traders in the world put in the elbow grease necessary to become extremely successful.

It’s no different for anyone else.

However, we CAN make it easier on you. Instead of leaving you to fend for yourself, we’re more than happy to give you the market “survival” skills necessary to fast-track your trading.

And the more tools you have in your toolkit, the faster you’ll get where you want to be.

That’s why there’s also no obligation here of any kind. And there never will be.

We simply hope that you love this offer – and the bonuses we’re going to send you – and that this will be the start of a relationship that will last for years.

The thing is, this IS a limited offer. Our system is dialed in to cut this promotion once it hits a download threshold. 

So you need to…

Take Action Today. 

This Limited Offer Won’t Last Long.

As I’ve mentioned a few times. This is a time sensitive and limited offer. 

We weren’t quite expecting the demand that we’re currently experiencing.

Our offer is already pushing the downloads at a time limit a ridiculous pace.

But if you’re seeing this right now, then that means you still have the opportunity to get in.

I can’t promise that window will remain open for much longer though.

So I highly advise that you claim your copy of The Price Action Trader right away.
HURRY! THIS IS A LIMITED TIME PROMOTION
countdown
00Hours00Minutes00Seconds
**IMPORTANT! BY READING OUR CONTENT YOU EXPLICITLY AGREE TO FOLLOWING. PLEASE READ CAREFULLY**

DISCLAIMERS

DISCLOSURE. GLFXACADEMY.COM, its managers, its employees, and assigns (collectively “The Company”) do not make any guarantee or warranty about what is advertised above. The Company is not affiliated with, nor does it receive compensation from, any specific security. While the Company will not engage in front-running or trading against its own recommendations, The Company and its managers and employees reserve the right to hold possession in certain securities featured in its communications. Such positions will be disclosed AND will not purchase or sell the security for at least two (2) market days after publication.

NOT AN INVESTMENT ADVISOR. The Company is not registered or licensed by any governing body in any jurisdiction to give investing advice or provide investment recommendation. ALWAYS DO YOUR OWN RESEARCH and consult with a licensed investment professional before making an investment. This communication should not be used as a basis for making any investment.

INDEMNIFICATION/RELEASE OF LIABILITY. By reading this communication, you agree to the terms of this disclaimer, including, but not limited to: releasing The Company, its affiliates, assigns and successors from any and all liability, damages, and injury from the information contained in this communication. You further warrant that you are solely responsible for any financial outcome that may come from your investment decisions.

FORWARD-LOOKING STATEMENT. As defined in the United States Securities Act of 1933 Section 27(a), as amended in the Securities Exchange Act of 1934 Section 21(e), statements in this communication which are not purely historical are forward-looking statements and include statements regarding beliefs, plans, intent, predictions or other statements of future tense.

PAST PERFORMANCE IS NOT INDICATIVE OF FUTURE RESULTS. Investing is inherently risky. While a potential for rewards exists, by investing, you are putting yourself at risk. You must be aware of the risks and be willing to accept them in order to invest in any type of security. Don’t trade with money you can’t afford to lose. This is neither a solicitation nor an offer to Buy/Sell securities. No representation is being made that any account will or is likely to achieve profits or losses similar to those discussed on this web site. The past performance of any trading system or methodology is not necessarily indicative of future results

CFTC RULE 4.41 – HYPOTHETICAL OR SIMULATED PERFORMANCE RESULTS HAVE CERTAIN LIMITATIONS. UNLIKE AN ACTUAL PERFORMANCE RECORD, SIMULATED RESULTS DO NOT REPRESENT ACTUAL TRADING. ALSO, SINCE THE TRADES HAVE NOT BEEN EXECUTED, THE RESULTS MAY HAVE UNDER-OR-OVER COMPENSATED FOR THE IMPACT, IF ANY, OF CERTAIN MARKET FACTORS, SUCH AS LACK OF LIQUIDITY. SIMULATED TRADING PROGRAMS IN GENERAL ARE ALSO SUBJECT TO THE FACT THAT THEY ARE DESIGNED WITH THE BENEFIT OF HINDSIGHT. NO REPRESENTATION IS BEING MADE THAT ANY ACCOUNT WILL OR IS LIKELY TO ACHIEVE PROFIT OR  sLOSSES SIMILAR TO THOSE SHOWN.

All trades, patterns, charts, systems, etc., discussed in this message and the product materials are for illustrative purposes only and not to be construed as specific advisory recommendations. All ideas and material presented are entirely those of the author and do not necessarily reflect those of the publisher. No system or methodology has ever been developed that can guarantee profits or ensure freedom from losses. No representation or implication is being made that using the methodology or system will generate profits or ensure freedom from losses. The testimonials and examples used herein are exceptional results, which do not apply to the average member, and are not intended to represent or guarantee that anyone will achieve the same or similar results.

AFFILIATES. Some or all of the content provided in this communication may be provided by an affiliate of The Company. Content provided by an affiliate may not be reviewed by the editorial staff member. Our affiliates may have their own disclosure policies that may differ from The Company’s policy.

TERMS OF USE. By reading this communication you agree that you have reviewed and fully agree to the Terms of Use found here . If you do not agree to the Terms of Use , please contact GLFXACADEMY.COM . to discontinue receiving future communications. s
2021 GLFX Academy LLC. All Rights Reserved
Powered By ClickFunnels.com